How Can We Picture Information? How Can We Model It Mathematically? Part II
By Keith Devlin @profkeithdevlin
This month’s essay completes a thread commenced with the May, June and July posts.
Last month, I described the sequence of events that led me to join an interdisciplinary team of researchers at Stanford University’s Center for the Study of Language and Information (CSLI) in 1987 to try and develop a mathematically-based theory of information, that could support analysis of human–human, human-machine, and machine-machine communication.

Figure 1. Use of this analytic/developmental methodology was implicit in the CSLI research of the 1980s and 90s. The diagram itself evolved subsequently over several years.
I outlined how my contribution as a mathematician involved my viewing the core problem domain (the nature of information and the mechanisms of information flow) using the Mathematical Cycle. In the CSLI case, use of the cycle required the development of some new mathematics. See Figure 1. (Although, as I noted, that representation itself was a result of my working on the CSLI project and a number of others over the years.)
In order to meet the requirements for a useful application of the Mathematical Cycle, the mathematical framework in the top right node has to capture the original real-world situation or phenomena sufficiently well, and at the same time permit the use of mathematics or mathematically-inspired tools or ways of analysis.
I noted in my previous post that the development of new mathematics often requires the formulation of a simple mathematical model (ideally, a picture) to guide and inspire the thinking, citing as examples the Bohr Atom in atomic physics and the Feynman Diagram in the study of subatomic-particle interactions. Developing such a diagram was one of the early successes of the CSLI project.
The extreme simplicity of such a diagram that is essential to making it effective can give the impression that it was thrown together on the back-of-an-envelope. And indeed, that is almost always true – but there’s a significant caveat. The brainstorming sessions that are the way such representations are developed, typically generate dozens of scribbled sketches. Identifying the one that is most effective can take a lot of time. (As I noted last month, the Bohr atom was just one of many models of an atom inspired by planetary systems; it is the one in all the textbooks because it proved to be the most effective one to use.)
For the two examples cited, Bohr and Feynman respectively had at their disposal an arsenal of powerful mathematical tools (e.g. calculus) to guide them in picking a model that self-evidently could allow those tools to be used. The same was not the case for a theory of information, however. For one thing (and this is an important thing), information in the sense we were trying to capture (namely, the sense that was implicit in the Leavitt–Whisler paper I led off with last time) is a social construct. Finding a simple model/diagram that captures it adequately, and at the same time permits/facilitates either the use of existing mathematics or the development of new mathematics, could have been a considerable challenge. In the event, an approach guided by theoretical computer science worked extremely well.
As always, the model does not have to capture the notion of interest exactly. (Real atoms don’t look remotely like Bohr’s model.) It just has to capture key features that permit useful analyses to be carried out.
So how did we proceed? The starting point for developing such a model was to look at how people use “information” in the world (whatever it is).
To that end, the first step was to be as clear and precise as possible about what people typically mean by the word “information”. (This part of the project was completed before I joined the team.)
What do people mean by the word “information”?
It turns out that, over the years, the word “information” has been used in three very different ways. The word first appeared in the 4th Century, where it was used to mean the result of being informed. A “man of information” meant a knowledgeable or learned person. This definition implicitly assumes information resides in a person’s mind.
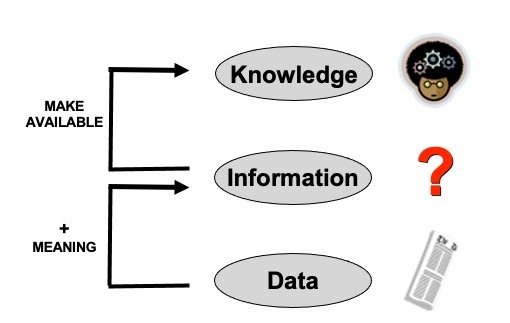
Figure 2. As information technology developed during the 1980s, people started using the terms knowledge, information, and data to refer to three distinct, but connected concepts.
In the mid-19th Century, with the growth of mass communications media (newspapers, dictionaries, reference books, libraries, postal services, telegraph, telephone, etc.), the word “information” came to refer to a social commodity that resides in/on various physical media. As such, information can be measured, shared, exchanged, sold, etc. It has physical form.
Then, in the mid-20th Century, with the development of computers, “information” came to be understood as referring to an abstract concept, separate from the various media on which it is represented or encoded. This new kind of information could be processed. This is the “information” of the IT world. Notice that it is defined in terms of being something that can be processed by certain technologies. It is neither in people’s heads nor in physical artifacts. It lies, in some sense, in between those two levels.
Given that meaning, how do people today refer to those two older conceptions of “information”? Well, the word “knowledge” is fairly consistently used to refer to the contents of people’s minds. And the word “data” meets the requirement of being (on) physical media. That leaves “information” to occupy the social space between data and minds, as in Figure 2.
In Figure 2, a newspaper carries data (the markings on the pages). An agent who can read that newspaper, that is, can provide meaning to the marks on the paper, thereby obtains information from the newspaper data. If that agent then incorporates the information into their existing web of knowledge, that new information becomes part of the agent’s knowledge.
Adopting this framework, the stuff we are call information lies between the physical world, where data exists, and the affective human mind (i.e. the mind of an agent that acts based on and guided by the knowledge it stores, ready for use). See Figure 3.

Figure 3. The Information Level. Information is a public, social construct that can be thought of as occupying its own level between the mental and physical worlds.
As we view it, then, the word “information” is used to refer to an abstract social construct, something that can have temporary and perhaps fleeting resting place in a mind, and which can be extracted from and deposited in the physical world where it is data.
When do we need to use the word “information”?
The next question was to ask under what circumstances we really need to use the word “information.” (Like all historical accounts, I am laying out the sequence that led to the model we eventually arrived at. When you are in the middle of such a project, things seem a lot less clear, and not remotely a linear path.)

Figure 4. While there are many ways to describe two people communicating face-to-face, discussing a conversation carried out remotely over come communication media seems to require reference to “information” flowing between them.
Referring to the left-hand image in Figure 4, if we see two people conversing in the street (say), we might say they are talking, chatting, conversing, arguing, etc. We are unlikely to say they are exchanging information, though that may well be the purpose of their meeting. If we do refer to the event as “providing information” or “exchanging information,” there is a connotation of something out-of-the-ordinary, say a spy meeting with their handler.
In contrast, it is practically impossible to succinctly describe the right-hand image except by referencing “information”. (It doesn’t matter if the two individuals are in the same room or miles apart, or if the connection between their devices is wired or wireless.) Indeed, thinking about what is going on seems best described using the term “information flow.”
Now we are faced with a new question. Just what is going on when “information flows”?
How does information flow?

Figure 5. The concept of “information” as a commodity created and consumed in human minds and carried on physical media developed with the growth of mass media in the Nineteenth Century.
Let’s take the archetypical example of information flow from the 19th Century that gave rise to the conception of information as a commodity. Figure 5 shows a journalist at a typewriter, writing a story. In terms of the flow of information from the journalist to the customer reading the newspaper the next morning, we would say the journalist produces the information that gets transmitted to the reader.
The newspaper itself then stores that information.
When the man at the breakfast table reads that particular story, we would say he acquires the information that the journalist produced.
How did that information – say, the result of the previous day’s football match – make its way from the journalist to the reader at another location, who reads it at a later time (the next morning, say)? Well, with this particular example, anyone who has seen a movie involving newspapers from the days of lead-type printing will know that there is a whole chain of activities, involving printing presses, newspaper baling machines, beefy guys throwing stacks of newspapers onto trucks, newsagents cutting open the bales and distributing the newspapers to high school kids who carry them on bicycles to throw onto front doorsteps all over town, and sleep-eyed guys like the one shown who pick up the paper in their dressing gown and put it onto the breakfast table, whereupon they read the paper over breakfast.
“I see United won yesterday,” the man says to his wife. How did he know that? Well, he acquired it from the newspaper. That complicated chain of events, most of which involved the packaging and shipment of sheets of paper, succeeded in taking information that began in the head of the journalist and putting it into the head of the reader.
From head to head, via a physical chain. Figure 6 illustrates the process.

Figure 6. Communication media such as newspapers succeed in transferring thoughts and ideas from one mind to another, over distance and time. In the 1980s, researchers at Stanford University’s Center for the Study of Language and Information set out to develop a mathematically.based theory to facilitate scientific discussion of this phenomenon.
When you stop and reflect on this familiar episode, it seems remarkable. How can the physical transportation of sheets of paper transmit one person’s thought, idea, story to end up as a thought in another person’s head, half way across town at a later time? The complexity of the sequence of events along the bottom (the solid blue arrow), while essential – it is after all the only thing that actually travels, in a physical sense – seems a distraction. We can imagine it happening in other ways, messengers on horseback in earlier times, by radio, television, and the Internet in today’s world, etc.
In all cases, the result is that the thought/idea/etc. moves along Fig 6’s blue dotted-line.
And now we have arrived at our desired conception of “information.” It’s what moves from mind to mind along the dotted line in Figure 6. (See Figure 7.)

Figure 7. The CSLI conceptualization of human-human communication postulates “information” as the abstract entity transferred between minds during a communicative event.
In our particular example, the information makes its way from journalist to reader by riding on the newspaper after leaving the journalist’s head, and eventually found its way down into the reader’s head.
[Being particularly attached to the obvious similarity of the above framework to particle physics, I coined the term “infon” to reify the “basic elements” of information that we view as moving from head to head. Though as the work progressed, the infon notion proved to be of little more than technical use, internal to the theory we were developing. Human-to-human communication is not that similar to particle physics or electrical flow.]
The information flow diagram
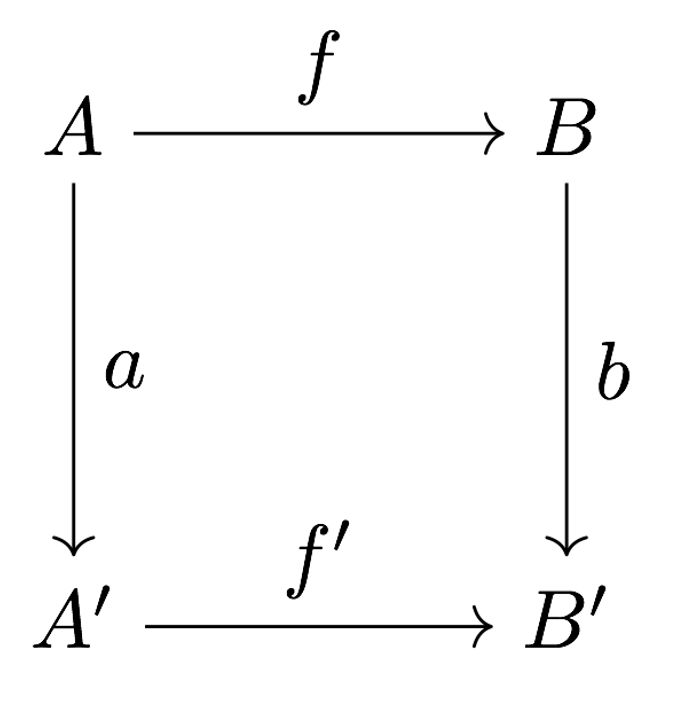
Figure 8. The Information Flow Diagram is an instance of the familiar algebraic concept of a commutative diagram.
So what is our analogy of the Bohr atom or the Feynman Diagram? It’s the line diagram shown in Figure 8. It’s a diagram very familiar to anyone who completed a bachelor’s degree in mathematics: it’s called the commutative diagram.
Just as the atomic physicists in the early Twentieth Century knew that using a planetary system as their inspiration for a model of the atom would allow them to make use of a broad panoply of powerful mathematical techniques, including calculus, so too the mathematicians and computer scientists on the CSLI team knew that an analysis of information flow that led to a commutative diagram would make available a broad range of techniques from modern algebra, where the commutative diagram is ubiquitous.
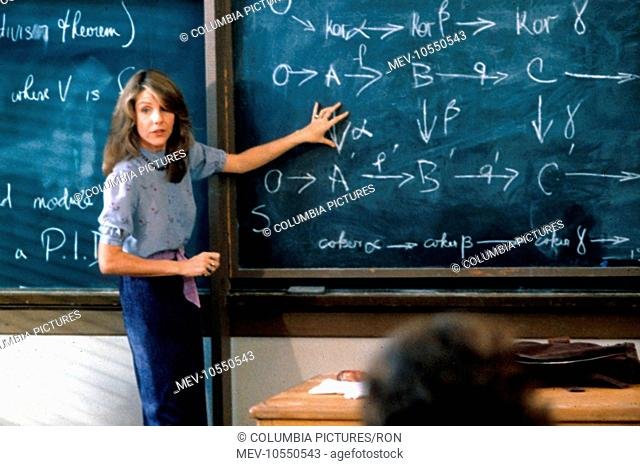
In fact, the commutative diagram has such iconic significance in modern algebra, that the 1980 Columbia Pictures movie It’s My Turn, starring Michael Douglass and Jill Clayburgh, opens with a two-minute scene where Clayburgh’s character proves a famous theorem about commutative diagrams.
Wanting to make it immediately clear to the audience that the character is an expert on advanced mathematics, the director sought assistance from a professional, university mathematician, Benedict Gross of Harvard, regarding what specific topic or result would properly convey modern, university-level mathematics.
Gross suggested the Snake Lemma from homological algebra would work well.
That’s how much the commutative diagram is in the mainstream of modern mathematics.
And in case you were wondering, the proof you see Clayburgh present in her lecture is correct. Gross not only scripted it, he also coached Clayburgh on her delivery. You can read the full story here.
Postscript: What came next?
Once CSLI researchers had a workable conceptualization of information, and guided by the Information Flow Diagram, (the “Bohr atom” for thinking about information), they went on to develop a whole framework for studying, analyzing and working with information (as defined within the framework just outlined) and how it is used in modern society. A mathematically-based framework called Situation Theory, initiated by CSLI co-founders Jon Barwise and John Perry in the early 1980s, was further developed to study the hugely important roll played by context in communication. Much of the research that made use of Situation Theory was in projects in linguistics, computer science, and philosophy.
I myself collaborated extensively with a linguist/ethnographer called Duska Rosenberg on utilizing Situation Theory and the CSLI information conception/framework in practical projects to improve workplace performance. Subsequent to that, after the September 11, 2001 terrorist attack on New York City, I applied the techniques Rosenberg and I developed in a series of intelligence analysis projects for the US Department of Defense.
The above account is a personal one, from my own perspective, written to bring out the role played by mathematics – in particular mathematical thinking – in the extensive multidisciplinary research project on language and information conducted at CSLI in the 1980s and 90s. In fact, as the culmination of a thread on the important role simple diagrams can play in complex analyses, my main goal here was to describe the development of the Information Flow Diagram. In terms of the entire spectrum of research conducted at CSLI, however, mathematical modeling was a small part of the activity.
Going beyond CSLI, since information (in the sense discussed here) is a social construct, with all the complexity that entails, providing a simple way to think about information and communication (the Information Flow Diagram) is arguably the most significant output from the CSLI mathematical modeling work per se, influencing research on the role of information in society. Unlike physics and the other natural and biological sciences, where mathematics plays a dominant role, in the social sciences it tends to play an advisory role (statistics aside).
But when you widen the lens from mathematics to mathematical thinking (as captured by the Mathematics Cycle), you find that mathematics had, and continues to have, considerable impact. For a general survey of some of the mathematical-thinking work that has been done, there is my own book InfoSense. If you want to go deeper and see the messy nuts-and-bolts an industrial application of the CSLI information theory framework, see my book with Rosenberg, Language at Work.
On the other hand, if it’s page after page of heavy-on-algebra mathematics you want to see, in particular commutative diagrams in full use, there is Barwise & Seligman’s book Information Flow.
