Peak AP Calculus, What Comes Next? Part II
By: David Bressoud @dbressoud

David Bressoud is DeWitt Wallace Professor of Mathematics at Macalester College and Director of the Conference Board of the Mathematical Sciences
This column was written before the covid-19 pandemic disrupted all of our lives. Nevertheless, I am keeping this post because it deals directly with issues of equity, one of the challenges that will almost certainly be exasperated by the switch to online instruction. I am interested in your thoughts on and experiences with this unplanned experiment. You can send them directly to me at bressoud@macalester.edu, subject line Launchings.
Last month, in Part I, I discussed the implications of the fact that enrollment in high school calculus has now surpassed 20% of the graduating class. This far exceeds the number of students who enter college with the intention of majoring in a STEM field. While few universities require high school calculus, it is widely recognized by college-bound students, their teachers, and their parents that calculus on the high school transcript will help gain admission to the most selective institutions. For access to the most competitive places, there is increasing demand for Calculus BC and for enrollment in AP Calculus before the senior year.
This is fine for students who have access to quality calculus instruction, but the inequalities of public education in the United States create a situation in which traditionally disadvantaged students are further harmed by lack of access to what has become a de facto requirement for admission to the best colleges and universities and successful preparation for mathematically intensive careers. When almost all of the students in Calculus I are repeating a course they passed in high school, those who are seeing this material for the first time are at a considerable disadvantage. When grades are assigned on a curve, so that doing well is not determined by how much you know rather than how you compare with the performance of the other students, these disadvantaged students face often insurmountable obstacles.
Only 53% of U.S. high schools offer AP Calculus, although 82% of students do have access to AP Calculus (Hayes, 2019). Even when it is available, success is almost always contingent on starting Algebra I by 8th grade. Using data from the U.S. Department of Education’s longitudinal study of the high school class of 2013, Champion and Mesa (2017) found that 41% of those who studied Algebra I by 8th grade enrolled in calculus while in high school, while only 5% of those who waited until 9th grade to take Algebra I did so (Table 1). Sadler and Sonnert’s large-scale FICSMath survey, conducted in 2009, found that among the students who eventually enrolled in mainstream Calculus I at a college or university, 50% were in Algebra I by 8th grade (Sadler and Sonnert, 2018, Table 1, p. 13). It is therefore disheartening that only 59% of schools offer Algebra I in 8th grade, and only 24% of 8th grade students take this course, with much lower percentages for Black and Hispanic students (Figure 1).

Table 1. Proportion of students completing various high school math courses by level of course taken in 9th grade (Below Algebra I, Algebra I, or Above Algebra I). (N = 14,740). Source: Champion and Mesa, 2017, p. 18.

Figure 1. Source: Civil Rights Data Collection 2015–16 and Common Core of Data 2015–16as cited in https://www2.ed.gov/datastory/stem/algebra/index.html#data-story-title
The real problem is not that there are too few students taking calculus in high school. It is that the opportunities for better high school preparation in mathematics is skewed toward richer and whiter students. Table 2 shows that while 19% of white students study calculus while in high school, only 8% of black students do. Socio-economic status is an even more powerful predictor. While 38% of students in the richest quartile study calculus, only 7% of those in the poorest do so (Table 3).

Table 2. Proportion of students completing mathematics courses by race (N = 15,188). Source: Champion and Mesa, p. 15

Table 3. Proportion of students completing mathematics courses by socio-economic status (N = 15,187). Low = 1st quartile, Medium = 2nd and 3rd quartile, High = 4th quartile. Source: Champion and Mesa, p. 16
The College Board has been very aware of these discrepancies, reporting on them regularly and working on programs to improve the situation. Table 4 and Figures 2 and 3 illustrate that there has been some progress, but not nearly enough. Table 4 looks at the proportion of student within each population that take an AP Calculus Exam and the proportion that score 3 or higher (equivalent to a C or higher in the comparable college course). Figures 2 and 3 exhibit how the racial and ethnic distribution of the student who score a 3 or higher has changed over the past twenty years.
Comparing Tables 2 and 4, we see that about 72% of the Asian students who study calculus in high school take an AP Calculus exam and earn 3 or higher. For white students, about 45% of those who have studied calculus take the AP Exam and earn 3 or higher. The percentage drops to 29% for Hispanic/Latinx students. For black students, only 19% of those who study calculus in high school also take the AP Exam and earn 3 or higher. Black students face not only much lower rates of enrollment in calculus but, for those who do enroll, much lower rates of successful completion as measured by the AP Calculus exams.
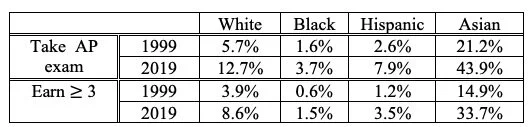
Table 4. Percentage of students in each racial/ethnic category taking an AP Calculus Exam in the indicated year and percentage earning 3 or higher. Percentage calculated as number of students reporting that category on the AP Calculus exam divided by the number of high school graduates in that category. Sources: College Board, 1999 and 2019a; NCES, 2019)

Figure 2. Distribution by race/ethnicity of U.S. students who took either AP Calculus Exam in 1999 and scored a 3 or higher. Actual percentage for American Indian/Alaska Native was 0.29%. Source: College Board, 1999.

Figure 3. Distribution by race/ethnicity of U.S. students who took either AP Calculus Exam in 2019 and scored a 3 or higher. Actual percentage for American Indian/Alaska Native was 0.22%. Source: College Board, 2019.
In 1999, white students made up just over 70% of high school graduates. In 2019, that was down to 52%, commensurate with the drop in the percentage of white students earning 3 or higher. Hispanic/Latinx high school graduates rose during this period from 11% to 24% of the total, partly but not totally accounting for their increased presence among those earning 3 or higher. Hispanic/Latinx student are also getting stronger preparation. The percentage of black students among high school graduates has stayed fairly constant, rising from 13% to 14%, but it is discouraging that over two decades their presence among those earning 3 or higher has remained stuck at 2%. For comparison, Asian students among high school graduates rose by 30% during this time, from 4.6% to 6%, while their presence among those earning 3 or higher rose by 73% (NCES 2018).
Over the next decade, the percentage of white students among high school graduates is projected to drop to 45% (NCES 2018). The percentage of Asian student is projected to stabilize around 6.6%. If we are to provide for the evolving workplace that demands ever greater levels of preparation in the mathematical sciences, we cannot afford complacency over low rates of successful preparation for college-level mathematics among black and Hispanic/Latinx students.
References
Champion, J. & Mesa, V. (2017). Factors Affecting Calculus Completion among U.S. High School Students. In D. Bressoud (Ed.) The Role of Calculus in the Transition from High School to College Mathematics. Washington, DC: MAA and NCTM. Retrieved March 9, 2020 from https://www.maa.org/sites/default/files/RoleOfCalc_rev.pdf
College Board. (1999). 1999 AP National Summary Reports. Retrieved December 30, 2019 from https://secure-media.collegeboard.org/digitalServices/pdf/research/national_1999.pdf
College Board. (2019). 2019 AP National Report. Retrieved December 30, 2019 from https://secure-media.collegeboard.org/digitalServices/misc/ap/national-summary-2019.xlsx
Hayes, M. L. (2019). 2018 NSSME+: Status of high school mathematics. Chapel Hill, NC: Horizon Research, Inc. http://horizon-research.com/NSSME/2018-nssme/research-products/reports
National Center for Education Statistics (NCES). (2018). Table 219.30. Public high school graduates by race/ethnicity. Retrieved March 9, 2020 from https://nces.ed.gov/programs/digest/d18/tables/dt18_219.30.asp?current=yes
Sadler, P. & Sonnert, G. (2018). The Path to College Calculus: The Impact of High School Coursework. Journal for Research in Mathematics Education, 49(3), 292–329.
Download the list of all past Launchings columns, dating back to 2005, with links to each column.