Trends in Math Degrees
By David Bressoud @dbressoud

David Bressoud is DeWitt Wallace Professor Emeritus at Macalester College and former Director of the Conference Board of the Mathematical Sciences. davidbressoud.org
Covid has disrupted the collection of all kinds of data, including the surveys of undergraduate programs in the mathematical sciences conducted by the Conference Board of the Mathematical Sciences (CBMS). The survey originally scheduled to go out in the fall of 2020 was delayed until 2021. Problems engendered by the Covid shutdown have meant that we are now only just beginning to get those results in presentable form. In the meantime, I will use this month’s Launchings column to dig into some of the data from the U.S. Department of Education’s National Center for Education Statistics (NCES) on degrees awarded in the mathematical sciences. Here also the data are only available up to 2021. But they do give us a window into important trends. Next month I will report data on degrees earned by students from various minorities.
Figure 1 shows the number of men and women earning a Bachelor’s degree in either mathematics or statistics (NCES does not separate the two). While there has been a very healthy increase in the number of majors since 2000, the total number of degrees earned in all fields has also increased. Figure 2 shows degrees in mathematics or staitstics as a percentage of all Bachelor’s degrees. This did not start increasing until after 2011 and still lies below 1.4%.

Figure 1. Number of Bachelor’s degrees in mathematics or statistics earned by men (blue diamonds) and women (red squares) from 1990 to 2021. Source: NCES Digest of Education Statistics

Figure 2. Bachelor’s degrees in matheamtics or statistics as a percentage of all Bachelor’s degrees awarded that year. Source: NCES Digest of Education Statistics
Figure 3 exhibits the percentage of Bachelor’s degrees in the mathematical sciences that were earned by women. While degrees have incresed for both men and women over the past two decades, the growth has clearly been much faster for men. The differences between NCES (blue squares) and CBMS data (red diamonds) shown in Figure 2 reflect different sources and definitions. CBMS data are collected from department chairs. NCES data are collected from institutional research offices and generally do not count second majors or majors in mathematics education.

Figure 3. Bachelor’s degrees in mathematics or statistics awarded to women as a percentage of all Bachelor’s degrees awarded in mathematics or statistics for that year. Sources: NCES Digest of Education Statistics for the blue squares; and CBMS surveys for the red diamonds.
Figure 4 compares the Bachelor’s degrees in the primary STEM majors. It illustrates the expansions and contractions in the popularity of computer science since 1980 and the strong growth in both biosciences and engineering during this century.
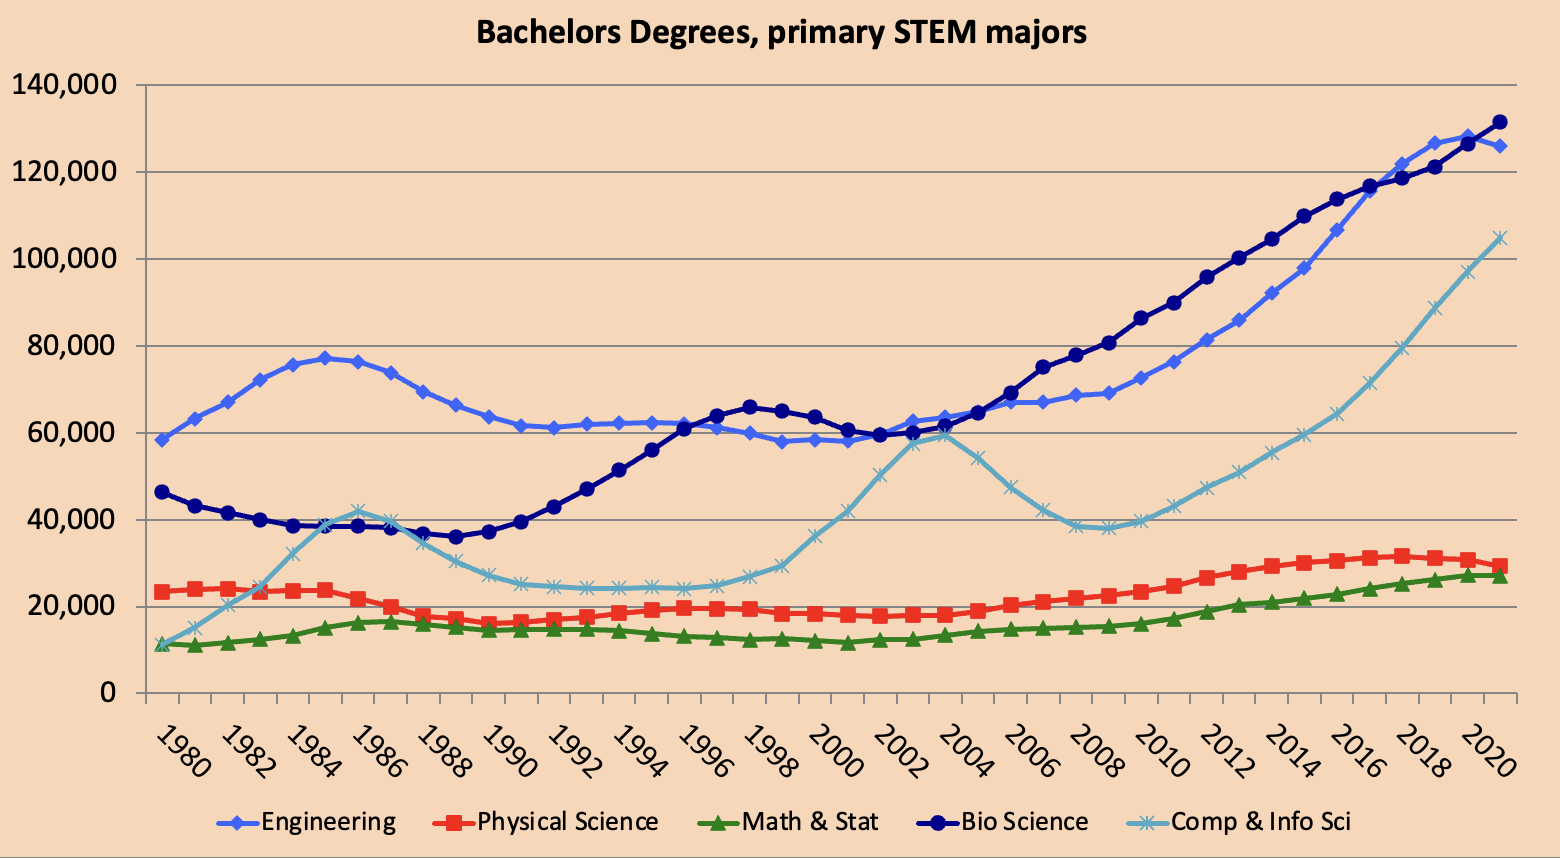
Figure 4.Total number of Bachelor’s degrees awarded in five fields: engineering, physical sciences, mathematics and statistics, biological sciences, and computer and information sciences. Source: NCES Digest of Education Statistics
Figure 5 compares the percentage of women majoring in the mathematical sciences to those in the two other most mathematically intensive majors: engineering and physical sciences.
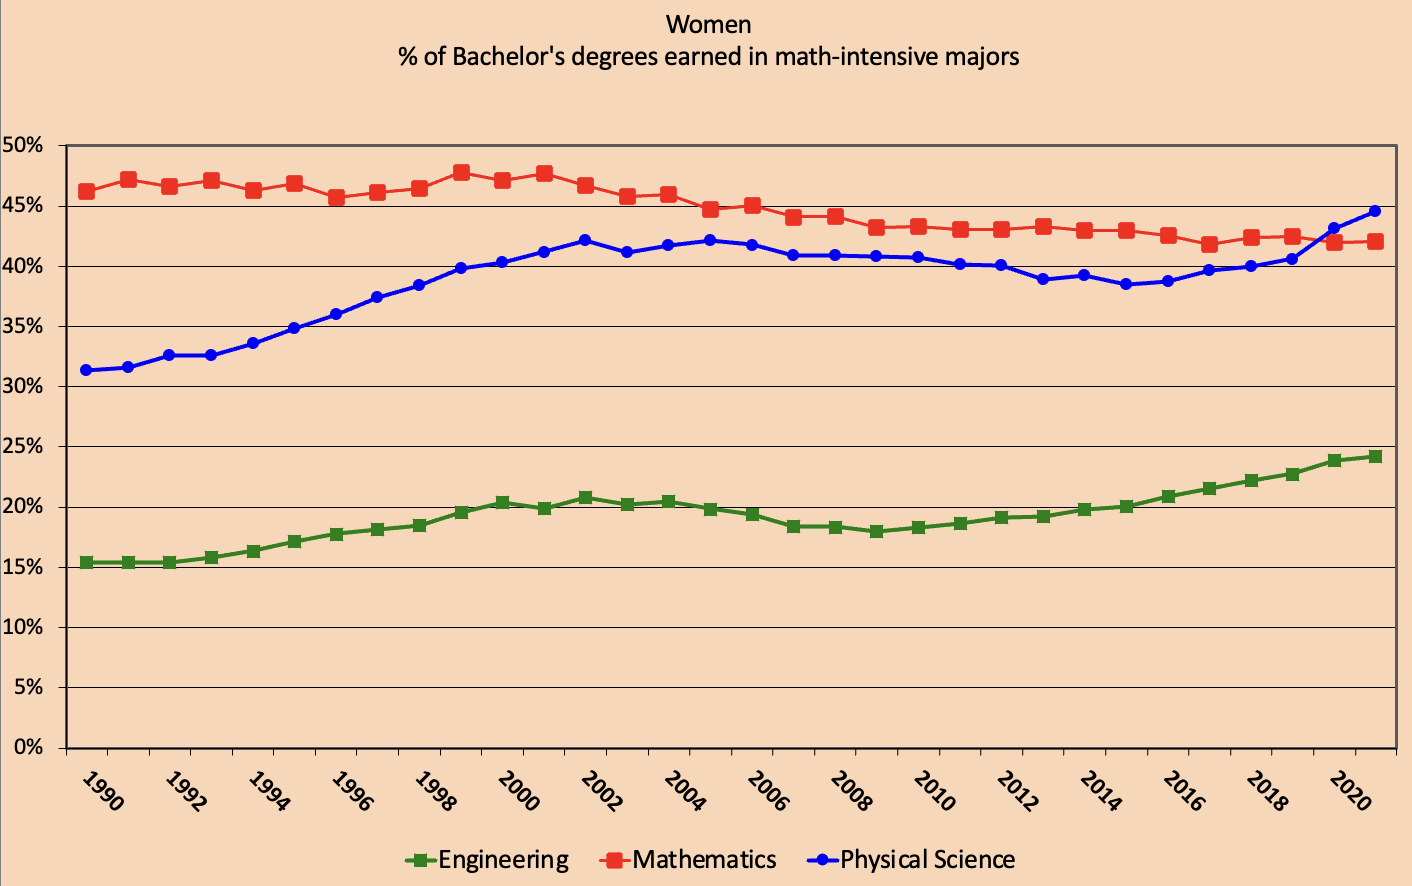
Figure 5. Bachelor’s degrees awarded to women as a percentage of all Bachelor’s degrees awarded in the respective field: engineering, mathematics and statistics, or physical sciences. Source: NCES Digest of Education Statistics
The physical sciences are principally physics and chemistry. My understanding is that women are much more likely to major in chemistry than physics, so combining these majors can be misleading. Nevertheless, it is interesting that since 2020 women have been slightly better represented in the physical than the mathematical sciences, a dramatic change from three decades ago. For decades, engineering faculty have struggled to get the percentage of women above 20%. It is encouraging to see that they are now closing in on 25%.
Figure 6 presents one of the most striking trends: the explosion of international students (officially designated as non-resident aliens) among majors in the mathematical sciences. In 2020, they reached 22% of these degrees, essentially the same for both men and women. This is in comparison to other STEM fields: 10% in engineering and in computer science, 7% in the physical sciences, and 6% in the biosciences. This is a phenomenon of just the past fifteen years. If we exclude non-U.S.-residents, growth in the number of Bachelor’s degrees in the mathematical sciences since 2006 is 54%, as opposed to 83% if we include them.

Figure 6. Bachelor’s degrees awarded to non-U.S.-residents (non-resident aliens) as a percentage of all Bachelor’s degrees awarded in the respective field: all Bachelor’s degrees, mathematics and statistics, or engineerings. Source: NCES Digest of Education Statistics
I conclude with data on Master’s and Doctoral degrees in the mathematical sciences, Figures 7 through 9. We see that little progress has been made in increasing the number or percentage of women earning doctoral degrees. The percentage peaked at 31% in 2008. It has since fallen to just below 28%. It is also worth mentioning that non-U.S.-residents made up 54% of the doctoral degrees awarded in the mathematical sciences in 2021. This is largely unchanged since 1990 when it was 51%.

Figure 7. Number of Master’s degrees in mathematics or statistics earned by men (blue diamonds) and women (red squares) from 1990 to 2021. Source: NCES Digest of Education Statistics

Figure 8. Number of Doctoral degrees in mathematics or statistics earned by men (blue diamonds) and women (red squares) from 1990 to 2021. Source: NCES Digest of Education Statistics
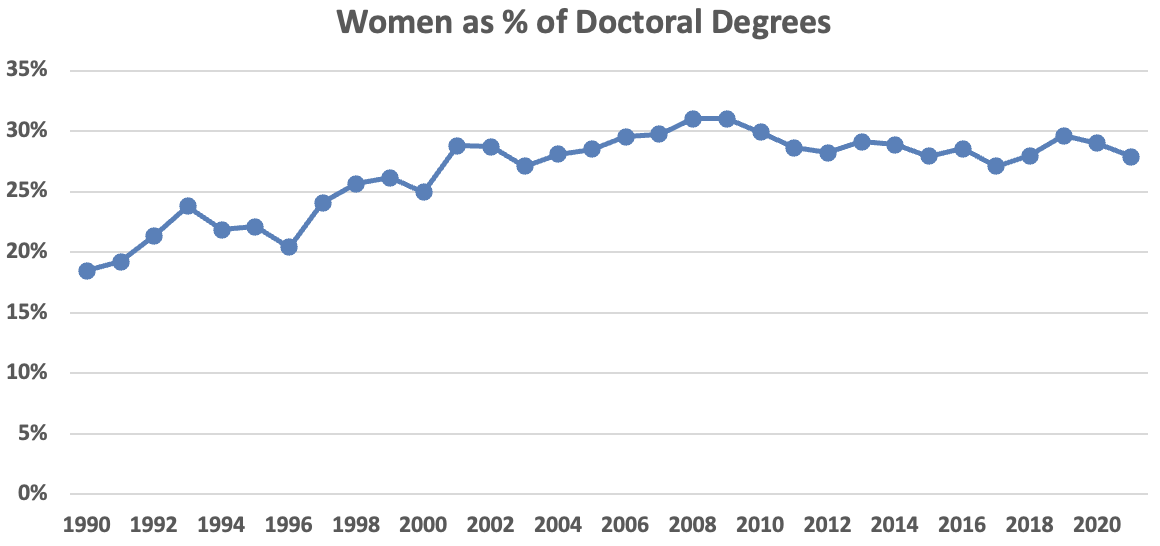
Figure 9. Doctoral degrees in mathematics or statistics awarded to women as a percentage of all Doctoral degrees awarded in mathematics or statistics for that year. Sources: NCES Digest of Education Statistics.
Note: The graphs are my creations, based on data from NCES annual reports going back to 1980.